Charter Schools
5 min read

8. What funding can charter schools receive?

8. What funding can charter schools receive?
Written by
Susan Perkins Weston
Published on
May 11, 2022

In 2022, House Bill 9 added rules for funding Kentucky charter schools. Those new provisions call for each charter school to share in most of federal, state, and local revenue available in their “district of location.” With that intent quite clear, the implementation is still going to be challenging. My big suggestion for working on the challenges is that we start building prototypes: models of what sample charter schools might receive based on the students they serve and the districts where they are located. Here, I’m going just dive in and show my understanding of key calculations, starting with SEEK base funding.

SEEK Base Basics

SEEK is short for Support Education Excellence in Kentucky, our main formula for funding public education. With only small modifications, we’ve used this approach since 1990, with a base guarantee for every pupil and a set of add-on amounts for students with additional needs. Here’s an illustration for an imaginary district. It starts with total students, counted based on average daily attendance, and then shows each group of students that receives an add-on. For simplicity, it uses the $4,000 guarantee amount being used this fiscal year.

Local school boards use their taxing powers to raise 30¢ for every $100 of taxable property in their districts, and that taxation raises varying amounts depending on districts’ assessed property values. The state then pays whatever is needed to complete the guarantee, which means state contributions are higher in districts with less property wealth and lower in districts with more.

SEEK Base For Charter Schools

Under HB 9, a public charter school is to receive:

“The amount that is proportional to the public charter school's enrollment or average daily attendance in comparison with the overall district qualifying numbers for:Funds that are related to students' attendance and enrollment and allocated to the district of location pursuant to KRS 157.360.”

KRS 157.360 is the statute that sets up the base part of the SEEK formula, so here’s my prototype of that step for two imaginary charter schools. These schools have matching numbers of total students but quite different student needs. Like the district numbers above, it begins with total students in average daily attendance and follows with the add-on amounts that go with the current $4,000 base guarantee.

This part of the funding will be the same everywhere in the state, though in future years the amounts per pupil will likely be at least little higher. Each charter school will receive these dollars from its “district of location,” but the amounts won’t vary based on the school’s address.

Tier 1 Optional Equalization

In addition to the guaranteed base, the SEEK formula allows districts to get some further state equalization called Tier 1, up to a maximum of 15% of the district’s SEEK base total. All districts are taking that maximum. The part the district puts in depends once again on its taxable property, but this time I want to illustrate how that works at three different levels of property wealth:

Because of the equalization, the property wealth doesn’t matter to what districts receive. Will it matter when districts pass dollars to charters? Maybe.

Tier 1 for Charter Schools

When Tier 1 dollars are shared out:

  • Will charter schools get shares based on qualified enrollment with all the weighting, giving Charter A 6% or the revenue and Charter B 3.8%? That would add about $283 thousand for Charter A and $179 thousand for Charter B.
  • Or will each get 5% and $236 thousand, based just on the count of pupils and ignoring the add on needs?
  • Or (take a deep breath), will they get the state dollars based on qualified enrollment and the local dollars per pupil? If it’s done that way, the district’s property assessments will matter. The richer the district, the more revenue will be local. The more the revenue is local and handed out without weights, the less the Charter A’s higher need students will receive.

As an advocate for equity that meets student needs, I definitely prefer the qualifying enrollment approach.Here’s the thing: after a week of reading HB 9’s funding provisions over and over again, I see how others could argue for either of the other methods. xI also think the stakes are big enough that key players are likely to argue hard for the version that works best for the students they expect to serve. Here's a table showing how differently the three approaches could work.

Other Puzzles

For each other part of school funding, my hunch is that there will be other puzzles to work through. Those other parts include:

  • SEEK transportation
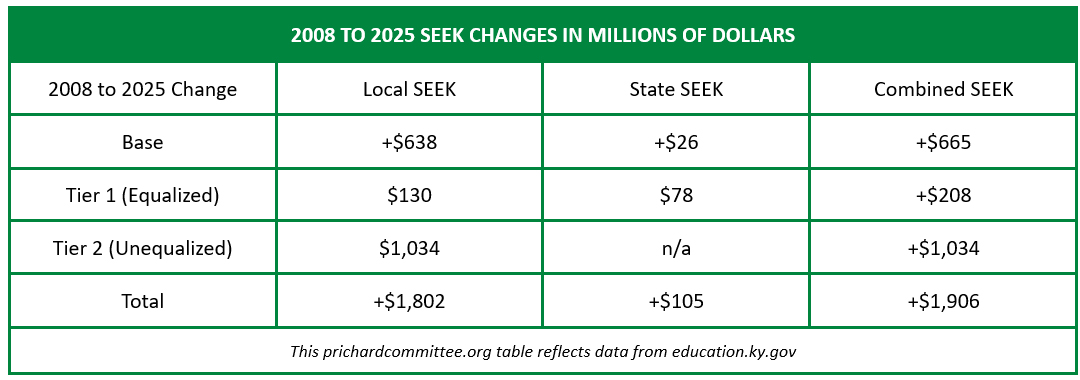
  • SEEK Tier 2 (unequalized local dollars capped at 30% of base plus Tier 1)
  • SEEK-funded stipends for National Board Certified Teachers
  • SEEK funds for a variety of facilities costs
  • State funding for school technology
  • State funding for other categorical programs
  • Federal funding for categorical programs

Each of these streams is worth prototyping the charter allocations and discussing with care. This is about big money and there will be big concerns. The best time to start working on those big issues is now, with maximum time to think through implications, consider any proposals to clarify the legal language, and (if possible) dependable information for all concerned.

Impact on Other Schools

None of this is going to be easy for any district where families choose a charter option. For example:

  • Districts have multi-year commitments to staff, equipment, utilities and building upkeep, and none of those commitments will shrink by 5% if enrollment changes by that proportion.
  • For any “district of location” where a charter school opens, in addition to amounts to be paid, there will be timing issues. Local revenue often comes from property taxes paid between November and January, so it will matter how much has to be paid out to each charter school before that November cash flow arrives.
  • For those districts of location, there will also be the disruption of having their local tax revenue divided up to pay for students whose homes (and family tax contributions) are in other school districts.
  • For other districts, when students leave to go to charter schools in other areas, there will also be disruptions. Eligibility for each kind of state and federal funding may decline. If local revenue is stable, that will offer the most cushioning to districts where the highest taxable property produces the largest local contribution.

At least for moment, try thinking of this as similar to the financial implications of a divorce with children involved. To give just one example, even if the division of property and income is done perfectly, the money that paid for one home will not pay for two homes at the same level of comfort. Dividing education revenue among more schools is going to require stretching the same dollars to cover more spaces and equipment and sorting out those changes will involve new negotiations, drafts and revisions, compromises and conflicts.Some readers are sure to think charters will have benefits worth the effort. Others are sure to think they won’t. Over time, some on either side may move toward the other view. For now, I want to offer a simpler point: funding charter schools is going to take effort. There are puzzles to be solved, and those solutions are likely to generate more puzzles. That work is right in front of us, and it needs attention.Adding a caveat: The prototype possibilities shared above are the best I can figure out on my own. It’s completely possible that readers who follow school funding will immediately see flaws in my reasoning. That’s kind of the point of sharing a prototype: it lets us find the glitches early. So please, bring on the questions, concerns, and alternate views of how this will work.

Legal sources: In 2022's House Bill 9, Section 7 has the rules for funding charter schools. (See pages 30 to 35). KRS 157.360 shows most of the rules for SEEK base funding, with the add-on for students with limited English proficiency shown only in budget legislation like 2022’s House Bill 1. House Bill 1 also provides that the SEEK base guarantee will move up from $4,000 to $4,100 next year and $4,200 the year after: the calculations above kept the $4,000 figure because it makes the arithmetic easier to follow. KRS 157.440 shows the Tier 1 and Tier 2 rules.

Series Links:

Charter schools: taking on the questions (Introduction)

1. What is a charter school?

2. What student results are charter schools expected to deliver?

3. Which school laws do charter schools have to follow?

4. How can students be admitted to charter schools?

5. Who can authorize charter schools?

6. Who can apply to start a charter school?

7. How can charter schools be closed if they do not deliver?

8. What funding can charter schools receive?

Adding new questions about charter schools (Conclusion)

Subscribe to our newsletter

Stay up to date with our work.

By subscribing, you consent to receive updates from The Prichard Committee.
Thank you! Your submission has been received!
Oops! Something went wrong while submitting the form.

Recent posts

HOW HAS SEEK FUNDING SHIFTED SINCE 2008?
5 min read

HOW HAS SEEK FUNDING SHIFTED SINCE 2008?

Since 1990, SEEK (short for Support Education Excellence in Kentucky) has been the Commonwealth’s main mechanism for...

Since 1990, SEEK (short for Support Education Excellence in Kentucky) has been the Commonwealth’s main mechanism for funding our common schools. From 2008 to 2025:

  • Local contributions to SEEK rose rapidly
  • State funding grew much more slowly
  • Combined funding did not keep up with inflation, growth in attending students, growth in students with added needs, or growth in transportation costs

In this post, we’ll offer brief background basics on the SEEK formula, and then break down changes to each part of the funding and the main context changes over these years. To start out, here’s a quick chart of the local and state changes over selected years.

BACKGROUND BASICS

The SEEK formula has three major funding components:

  • SEEK Base provides the largest share of funding, determined by adding up a guaranteed amount per pupil, add-on amounts for students with added needs, and a transportation amount. The resulting total is paid by combining local tax and state dollars.
  • Tier 1 also combines local and state dollars. It’s officially optional, but all districts now contribute enough local revenue to qualify for maximum state equalization.
  • Tier 2 is strictly local dollars, with no state equalization.

For a more detailed demonstration of the SEEK formula at work, check out the newest edition of our “SEEK Explainer.”

State budget legislation has made four recent changes that make the formula more generous.

  • Counting kindergarten students as full day students for Base funding purposes, starting in 2022
  • Increasing the Base guarantee per pupil from $4,000 in 2020 to $4,326 in 2025
  • Moving student transportation funding closer to covering full needs in 2025 than in recent past budgets
  • Expanding Tier 1 eligibility to 17.5% of Base revenue

The analysis shared below includes the impact of all four of those changes.

SEEK BASE

The local share of SEEK base grew 81% from 2008 to 2025. That happened because assessed property values grew 81%, from $262 billion to $474 billion, and each district’s local share is defined as 30¢ per $100 of its assessed property value. Over the same years, state base funding grew only 1%.

TIER 1 EQUALIZED FUNDING

Local Tier 1 funding grew 42%, and state funding grew 50%. When districts set tax rates to bring in more than the 30¢ SEEK base revenue, Tier 1 provides state equalization dollars. Through 2024, districts could receive Tier 1 dollars up to 15% of their SEEK base revenue. In 2025, state budget legislation moved that maximum up to 17.5%.

TIER 2 UNEQUALIZED FUNDING

Tier 2 districts to go beyond Tier 1 to raise dollars that the state will not equalize. That further revenue is limited to 30% of their combined SEEK base and Tier 1 state and local funding, with all dollars coming from local taxation. From 2008 to 2025, that unequalized funding grew very fast, increasing by 199%.

COMBINED CHANGES

Combining Base, Tier 1, and Tier 2 state and local dollars together, SEEK saw an increase of 47% and $1,906 million. The two tables show the combined change results.

WAS 47% AN ADEQUATE INCREASE?

Growth at that pace, created mainly from local resources, created challenges for our schools.

First, the cost of living went up 50%. That’s based on changes to the Consumer Price Index from December 2007 to December 2024 (the midpoints of the two school years).

Second, transportation costs rose faster than inflation. The official state transportation calculation reported that getting students to school and home again had a price tag of $271 million in 2008 and $488 million in 2025—an increase of 80%. State law says the entire cost will be included in the SEEK funding process, but state budget bills have regularly provided less than that. As a result, each district receives a fraction of what the formula promises. In 2024 and 2025, state budget legislation increased transportation funding, but did not eliminate the shortfall.

Third, student needs grew dramatically over these years.  Compared to 2008, 2025 Kentucky schools are serving:

  • 82,029 more at risk students eligible for free meals
  • 34,325 more students with limited English proficiency
  • 4,754 more students with severe disabilities
  • 1,188 more students with moderate disabilities
  • 1,403 more students with communications delays
  • 507 more students receiving home/hospital services

The SEEK formula identifies those students as adding to the costs of teaching and learning, but combined SEEK revenue showed no after-inflation growth that could have kept up with those added needs.

WAS THE INCREASE FAIRLY SHARED?

The changes relied heavily on unequalized Tier 2 dollars. When funding is unequalized, districts with less taxable wealth bring in less revenue than those with more resources, even when they set identical tax rates.

One way to show that wealth-based difference is to sort districts by their wealth per pupil, and then divide them into five roughly equal groups, often called quintiles. We did a quick and simple quintile analysis of 2025 Tier 2 revenue, and found far less Tier 2 revenue in the lowest wealth districts than in the places with the most wealth to tax. The chart below shows a 2025 funding gap of more than $500 million between the wealthiest and least wealthy set of districts.

A CONCLUDING NOTE

SEEK was designed to provide a sturdy and fair financial foundation for Kentucky’s reformed school system. Changes since 2008 have weakened that foundation, with local districts now contributing substantially more than the state, but without enough combined revenue to keep up with costs and students needs and with sharp differences in resources available to districts with lower and higher levels of taxable wealth. To build a Big Bold Future, Kentucky will need a renewed commitment to adequate and equitable funding for all public schools.

This analysis was prepared by Susan Perkins Weston. For further information on SEEK funding, check out:

Community Action is Key to Improving Education Outcomes in Kentucky
5 min read

Community Action is Key to Improving Education Outcomes in Kentucky

The Big Bold Future National Rankings Report, released biennially by the Prichard Committee for Academic Excellence...

This op-ed originally appeared in the Kentucky Gazette.

The Big Bold Future National Rankings Report, released biennially by the Prichard Committee for Academic Excellence, measures how Kentucky ranks on key indicators of education and economic well-being among the 50 states. While there were some bright spots this year—such as our high school graduation rate and improvements in fourth-grade reading—the overall picture is concerning. Kentucky’s progress in many important educational and quality-of-life indicators is too slow, and in some cases, we are falling behind. These results demand action.

The Prichard Committee’s 2025 Groundswell Community Profiles provide a tool to help us respond. The Groundswell Community Profiles offer an in-depth look at the state of education in each of Kentucky’s 171 school districts. They provide essential local data on learning progress, economic conditions, and health factors that influence student success. With this information, community members can compare their school district’s performance to state averages, identify areas that need improvement, and tailor solutions to fit their unique needs.

It is not enough to simply acknowledge these statistics. We must use them to drive real change. The success of our schools directly affects our economy, workforce readiness, and overall quality of life. By engaging with these profiles, local leaders, parents, educators, and concerned citizens can take meaningful action to improve education outcomes in their own communities. Here’s how:

1. Understand Your Community’s Data: The Groundswell Community Profiles provide a clear picture of where your local schools stand. Are reading and math scores improving? Is postsecondary enrollment increasing or declining? How does broadband access impact learning in your area? Identifying these trends is the first step toward creating a plan for improvement.

2. Start Conversations That Lead to Action: Data is powerful, but it only leads to change when people act on it. Use the Community Profiles to start discussions with school leaders, elected officials, and fellow community members. Attend school board meetings, organize forums, and encourage dialogue about local education challenges and opportunities.

3. Leverage Community Assets and Resources: Schools thrive when communities are actively involved. Volunteer at local schools, mentor students, or participate in programs that provide additional support to educators. When students see that their community values education, they are more likely to stay engaged and succeed. And remember, students’ needs don’t stop in the classroom; working toward removing non-academic barriers to student success (such as chronic absenteeism, food insecurity or mental health issues) is a powerful way to improve education outcomes.

4. Monitor Progress and Hold Ourselves Accountable: Change doesn’t happen overnight. The Groundswell Community Profiles are updated annually, providing a valuable tool for tracking progress over time. We should all use them to hold ourselves accountable for educational improvements.

We’re seeing the community-centered school model working through early data from the 20 districts across the state participating in the Kentucky Community School Initiative. This initiative champions community-led educational solutions tailored specifically for Kentucky students and their families. When implemented effectively, the community schools model has been proven to boost student outcomes, increase college enrollments, and contribute to the overall well-being of students, especially in high-poverty schools. The goal is to coordinate existing community resources to reduce non-academic barriers to learning—such as transportation, mental health, housing and hunger—so Kentucky teachers and students can focus on academics.

The challenges outlined in the Big Bold Future National Rankings Report are not insurmountable but addressing them requires collective effort. Every Kentuckian has a role to play in improving education outcomes, and the Groundswell Community Profiles and community schools model offer roadmaps for action. By using these tools to engage with our communities, work for change, and support students, we can build a stronger, more prosperous Kentucky.

Now is the time to act. Visit prichardcommittee.org/community-profiles to explore the data for your district and take the first step toward making a difference. A Big Bold Future for Kentucky starts with us.

From Policy to Partnership: How Communities Will Shape What Comes Next
5 min read

From Policy to Partnership: How Communities Will Shape What Comes Next

The 2025 legislative session came at a time when Kentuckians are not only demanding more from our education systems...

The 2025 legislative session came at a time when Kentuckians are not only demanding more from our education systems—they’re rethinking how those systems should work in the first place. The latest Big Bold Future National Rankings report confirms the stakes: Kentucky ranks 47th in preschool enrollment, 46th in postsecondary enrollment, and 44th in degree attainment. But across the state, communities aren’t waiting. Through FAFSA campaigns, early learning collaboratives, and new models for dual credit, tutoring, and diploma redesign, local leaders are building the future from the ground up. This session offered new tools to support that momentum—but real change will come from how we reimagine, re-center, and rebuild systems in partnership with the people they’re meant to serve.

HIGHLIGHTS FROM THE 2025 SESSION

  • HB 193: Dual Credit Scholarship Expansion
    Removes grade-level restrictions on scholarships, allowing more students—especially in earlier grades—to access college-level coursework with financial support.
  • HB 208: Cell Phone Policy in Schools
    Directs local school boards to implement prohibitions on student use of personal devices during the instructional day, balancing local control with statewide expectations.
  • HB 240: Kindergarten Readiness and Retention
    Requires schools to give end-of-year reading assessments to all kindergarten and first-grade students, and to hold back students who do not meet reading goals for their grade level.
  • HB 241: Virtual Learning Programs
    Ensures school districts can maintain funding during disasters by allowing them to make up instructional hours and waiving up to five days and also sets clear standards for virtual learning to maintain educational quality in any setting.
  • SB 68: Learning Capacities Modernization
    Updates definitions and expectations around learning capacities in schools, focused on workforce readiness and essential durable skills like critical thinking and problem solving.  

These policies, if implemented well, can support the local momentum we are already seeing in place-based work across Kentucky. But policy alone is not enough. We must invest in the infrastructure, advising, data, and partnerships that turn policy into impact.

Even as momentum built around student opportunity and system innovation, one bill introduced significant questions about how we support access and student success in higher education. House Bill 4 limits how public colleges and universities in Kentucky can design programs or offer services that focus on identity or background. It prohibits institutions from funding or requiring certain trainings, offices, or programs—even those that have helped students feel seen, supported, and ready to succeed. While the bill aims to promote a range of viewpoints, it introduces new uncertainty that could impact how campuses support students.  

Because the language is broad, colleges may interpret the new law in different ways—some may continue offering broadly accessible supports and services, while others may limit programs out of caution. These varied responses could leave students unsure about the supports they can count on.

Even with these changes, the need for student support has not gone away. Community organizations will become increasingly important in helping students navigate college, stay on track, and reach their goals. It will be important to track the impact this has on already stagnant college going rates in Kentucky, particularly since an estimated 75% of good jobs will require some form of postsecondary training by the year 2040. To ensure all students continue to have a fair shot, colleges and partners must prioritize transparency—reporting on how policies affect access, persistence, and success—especially for those student groups already facing persistent achievement gap—and adjusting when needed.

THE PATH AHEAD

As the dust settles on the 2025 session, the Prichard Committee’s focus is squarely on turning policy into progress—through clear implementation, local engagement, and ongoing accountability. We are committed to a path forward built around:

  • Empowering communities to lead improvement.
    Through community profiles and place-based strategies, we are working alongside Kentuckians to design local solutions to challenges in early learning, school climate, and student transitions. Across the state, we see the power of strong partnerships—between schools, families, and local organizations—to remove barriers, expand opportunity, and drive sustainable change.
  • Expanding access to advanced coursework and postsecondary pathways.
    With HB 190 and HB 193 now law, our next steps include supporting districts to implement automatic enrollment fairly across the board, strengthen advising, and expand course availability—especially in under-resourced areas. We’ll continue working with partners to ensure students don’t just access advanced courses but thrive in them.
  • Lifting up meaningful diplomas and transition readiness.
    We’re working with employers, educators, and families to define what a high school diploma should signify in today’s economy—and to ensure all students leave high school ready for college, career, and community life. That means strengthening advising, boosting dual credit success, and ensuring durable skills are embedded in core instruction.
  • Building better early childhood systems through family voice and workforce focus.
    We are supporting communities in aligning early childhood programs with family needs and economic realities, including quality improvement strategies and support for providers. With Kentucky ranked 47th in preschool enrollment, this remains one of the most urgent investments the state must make.  
  • Improving data transparency and shared accountability.
    We continue our call for strong public access to education data so communities can understand what’s happening and act on it. That includes data on school performance, course access, early learning participation, and postsecondary outcomes—broken down by region, race, and economic status.
  • Rebuilding trust in public education through consistent community engagement.
    We’ll continue to mobilize families, students, and educators to take part in local school decisions, improvement planning, and accountability conversations—with a growing emphasis on student efficacy, so young people see themselves as capable agents in their own learning and success. As the Big Bold Future report states, “transparency, accountability, and community participation” must be foundational to every effort.

The policies passed this session set the stage—but they won’t deliver results on their own. The challenge now is to turn opportunity into impact. That means local partnerships must move from intention to action. Schools can’t do it alone. Community organizations, nonprofits, and families have a critical role to play in making sure students are supported, systems are responsive, and progress is real. This is the moment calls for community-building as implementation—because lasting change grows from relationships, trust, and shared responsibility.  

Kentucky’s future will be shaped by what we choose to do next, together.