Policy Matters
Ed.
5 min read

SEEK In the House Budget: An Explainer

SEEK In the House Budget: An Explainer
Written by
The Prichard Committee
Published on
February 7, 2024

For Kentucky K-12 education, one question comes first when analyzing state budget proposals: How will the plan affect Kentucky’s biggest funding program, known as SEEK (short for Support Education Excellence in Kentucky)? On February 1, the House approved a committee substitute version of House Bill 6, and this explainer takes on that first K-12 question.


Here’s the twist: the one question can be answered four ways. Comparing current FY 2024 resources to what HB6 offers for FY 2026, one can say:

  1. The SEEK base guarantee per student will rise $255.
  2. State SEEK base funding dollars will drop by more than $119 million.
  3. Total flexible SEEK funding will decline about $6 million (combining base SEEK, SEEK transportation, and Tier 1).
  4. Grand total SEEK funding will rise a bit more than $26 million (combining the flexible dollars, retirement contribution, facilities funding, and other earmarked resources).

Here, I’ll explain each answer in turn. Clarity on these four ways to address the SEEK question can contribute to shared understanding of the budget debates that will now move to the Senate for next action steps.

1. The SEEK base guarantee per student will rise $255

The guarantee per student will increase from the current $4,200 to $4,455. That’s the amount that districts are guaranteed for each student in ADA (adjusted average daily attendance).

2. State SEEK base funding will decline by more than $119 million

Feel free to blink a few times at per student rising while the total declines.

The simplest explanation is the state doesn’t pay the whole per student amount: it only guarantees that districts will end up with those dollars. The heart of the formula is three steps:

  • Districts are guaranteed base funding, calculated by multiplying the per-student amount by district ADA.
  • Districts pay part of the guaranteed base funding, with their share defined as 30¢ per $100 of the assessed value of their taxable property.
  • The state pays the rest of the guaranteed base funding, with the state portion being the guaranteed amount minus the district 30¢ revenue.

The process has a powerful effect on equity in our schools: districts contribute according to their local assets, but the formula guarantees them the same base amount per student whether their resources are lower than state average, close to average, or above average. This formula approach was one of the most important innovations of the Kentucky Education Reform Act of 1990.

This process also means that in step 1, declining ADA can lower district totals, and in step 2 rising property values can increase the local share. Both changes can result in the state share declining even when the per pupil guarantee is rising.

Both of those other changes are happening. ADA has declined both because Kentucky has fewer school-aged children and because of increasing student absence rates. And property values have increased substantially. Working together, the two trends explain how HB 6 can have a lower total appropriation for base SEEK with an increasing base guarantee per student.

This explanation needs one further element. The SEEK base appropriation also funds add-on amounts based on students with added needs: those eligible for free meals, with identified disabilities, learning English, and receiving home and hospital services. The amount for each student with those needs is tied to the guarantee per student, rising when the guarantee rises. The add-on portion further strengthens equity by adjusting for factors that can result in added student learning costs.

3. SEEK funding with flexibility will decline about $6 million

SEEK can also be understood as more than just the base portion. When I speak of SEEK as Kentucky’s main program for funding K-12 education, I’m thinking of the three line items that provide districts with completely flexible resources. On that understanding, SEEK funding includes:

  • The base discussed above, including the add-ons.
  • Transportation funding, based on a separate calculation that uses student rider counts, distances traveled and other cost factors.
  • A Tier I optional element: districts can voluntarily raise revenue above the 30¢ per $100 and qualify for state equalization that gives them up to 15% more revenue.

In Kentucky law, school districts can use any part of those resources to pay any part of their costs for teaching, learning, and operations. Or, to say it another way, these three flexible parts do not come with “earmarks” requiring districts to account for how each dollar was used to provide a required service. In contrast, other parts of the state education budget do come with strings attached, requiring those dollars to be spent on reading interventions, preschool services, facilities, and other specifics.

Taking the three parts together, total SEEK funding with flexibility will also decline from FY 2024 to FY 2026 under the current HB 6.

The increased transportation funding is a very positive thing. In FY 2026, the appropriation will cover full cost of school transportation for the first time in many years. Resuming full funding is an important element of the Big Bold Ask. It’s a stand-out improvement proposed in the current HB 6.

The transportation increase will balance out some of the decline in SEEK base and Tier 1, but not all of it. Looking at the three lines together, districts stand to receive fewer flexible SEEK dollars in FY 2026 than they are getting in current FY 2024.

These flexible SEEK dollars matter because they are available for any school need. For example, these are the only three state budget line items that can be used to improve districtwide salary scales, recruit new staff, and financially reward current hard-working educators for the extraordinarily challenging work we ask them to take on.

4. Grand total SEEK funding will rise a bit more than $26 million

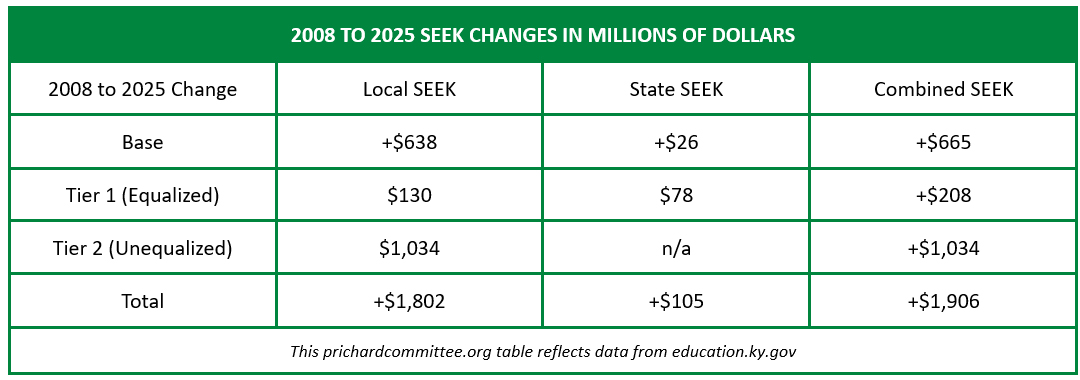
There’s one more way to talk about SEEK. In state budget bills, the Department of Education has three numbered sections, starting with “1. Support Education Excellence Kentucky.” That section includes the flexible line items just discussed, and it also includes funding that is legally committed to teachers’ retirement, school facilities, and a few smaller items. Here’s a table showing them all.

The grand total will increase by $26.4 million, meaning that the state will spend more in this budget section in FY 2026 than it is planning to spend in the current FY 2024.

A Concluding Note

One question – How will HB 6 affect SEEK? – has four possible answers. Under the House Committee Substitute, the guarantee per student will rise, base dollars will decline, total flexible funding will decline, and the grand total budget section will increase.

Ideally, this explainer will lead readers to ask follow-up questions about what this budget will make possible for Kentucky’s students.

Some of the follow-up questions can be about whether these dollars enable adjustments to the salaries paid to teachers and other education staff. With the flexible dollars are going down, it’s hard to say the bill provides state funding to strengthen those payrolls. That can be true even while we are celebrating the transportation boost and being glad to see the increases for retirement and facilities.

There can be many other questions, and then there should be one essential question beneath all the others: how well will these dollars, in concert with local and federal funds, help Kentucky build a big bold future, both for individual students and for the entire commonwealth? That’s the right puzzle for all of us to consider.

Subscribe to our newsletter

Stay up to date with our work.

By subscribing, you consent to receive updates from The Prichard Committee.
Thank you! Your submission has been received!
Oops! Something went wrong while submitting the form.

Recent posts

The Prichard Committee Releases 2025 Groundswell Community Profiles 
5 min read

The Prichard Committee Releases 2025 Groundswell Community Profiles 

The Prichard Committee for Academic Excellence today released the 2025 Groundswell Community Profiles...

Contact: Lisa McKinney, Communications Director, The Prichard Committee

(cell) 859-475-7202

lisa@prichardcommittee.org

The Prichard Committee Releases 2025 Groundswell Community Profiles

Profiles show strong points and weak spots on indicators of education and economic well-being for each Kentucky school district

LEXINGTON, Ky — The Prichard Committee for Academic Excellence today released the 2025 Groundswell Community Profiles, offering an in-depth look at the state of education in each of Kentucky’s 171 school districts. These profiles provide key indicators of learning progress from early childhood through postsecondary education, enabling communities to compare local school district performance to state averages on critical education measures.

As part of its commitment to fostering community engagement in education, the Prichard Committee updates and publishes the Groundswell Community Profiles annually ensuring Kentuckians have access to essential local data on educational progress.  

“Real, lasting progress in education and economic outcomes happens when communities are deeply engaged at the local level,” said Prichard Committee President/CEO Brigitte Blom. “It’s up to all of us to take an active role in shaping the educational landscape of our commonwealth. The Groundswell Community Profiles are designed to spark local discussions on bridging educational gaps, using the unique strengths and resources of each community to build a brighter future for all Kentuckians.”

Beyond education, the profiles incorporate economic and health data linked to educational success, illustrating the long-term influence of learning on both individual and community well-being.

The profiles are a companion to the Big Bold Future National Rankings Report, which was released last week by the Prichard Committee. Although the National Rankings Report showed Kentucky is recovering from COVID-19 learning losses faster than most states, many of the quality-of-life indicators show Kentucky declining in the rankings among the 50 states or improving too slowly to move Kentucky up into the top 20 states within a decade.

“The 2025 Groundswell Community Profiles complement the Big Bold Future National Rankings Report, illustrating how improvements at the local level collectively raise Kentucky’s standing among all 50 states,” said Todd Baldwin, director of the Center for Best Practices and Innovation at the Prichard Committee. “By identifying each district’s strengths and needs, the profiles help communities tailor strategies that boost student success, enhance workforce readiness, and improve quality of life. As more local districts make measurable progress, Kentucky moves upward in the national rankings—proving that when every community thrives, the entire commonwealth benefits.”

To explore the 2025 Groundswell Community Profile for your school district, visit prichardcommittee.org/community-profiles.

------

The Prichard Committee believes in the power and promise of public education –early childhood through college– to ensure Kentuckians’ economic and social well-being. We are a citizen-led, non-partisan, solutions-focused nonprofit, established in 1983 with a singular mission of realizing a path to a larger life for Kentuckians with education at the core.

Statement from Brigitte Blom, President/CEO of the Prichard Committee for Academic Excellence
5 min read

Statement from Brigitte Blom, President/CEO of the Prichard Committee for Academic Excellence

Today, the Prichard Committee released the 2025 edition of the Big Bold Future National Rankings Report...

Feb. 6, 2025

Contact: Lisa McKinney, Communications Director, The Prichard Committee

(cell) 859-475-7202

lisa@prichardcommittee.org

Statement from Brigitte Blom, President/CEO of the Prichard Committee for Academic Excellence

LEXINGTON, Ky — Today, the Prichard Committee released the 2025 edition of the Big Bold Future National Rankings Report, and bluntly, much of the new evidence is troubling.

In 2020, the Prichard Committee urged all Kentuckians to join the work of creating a Big Bold Future for the Commonwealth. To frame that work, we identified key indicators of educational achievement and quality of life to compile into a biennial national rankings report. Together, these data points let us:

  • Compare our work to other states
  • Analyze trends over the years
  • See results for Kentuckians of varied backgrounds and ages
  • Find cause for celebration
  • Recognize areas of concern

The 2025 report contains some good news. Kentucky is moving back toward 2019 reading and math test scores, as shown in last week’s results from the National Assessment of Educational Progress (NAEP). The NAEP scores indicate Kentucky has been more successful than most other states in recovering from the learning loss that was exacerbated by the COVID-19 pandemic. However, our NAEP scores have not fully bounced back to 2019 levels, and the 2019 levels were not strong enough. However, most other indicators show Kentucky declining in the rankings among the 50 states or improvement that is too slow to move Kentucky up into the top 20 states within a decade. Below are Kentucky’s rankings on the 14 included indicators: Bright Spots

  • 4th of 50 states in high school graduation rate
  • 4th in two-year postsecondary graduation rate
  • 12th in grade four reading

Strong Trends (on pace to be one of the top 20 states in another decade)

  • 25th and rising in voter turnout
  • 27th and rising in four-year postsecondary graduation rate

Weak Trends (not on pace to be one of the top 20 states in the next decade)

  • 32nd and rising slowly in grade 8 math
  • 33rd and rising slowly in babies with healthy birth weight
  • 46th and rising slowly in life expectancy

Declining/Flat Rankings

  • 42nd and declining in households with broadband access
  • 44th and unchanged in residents holding associate degrees or higher
  • 46th and declining in children living at or above the poverty line
  • 46th and declining in postsecondary enrollment
  • 46th and unchanged in household median income
  • 47th and declining in preschool enrollment


These results should summon us all to new effort.

The Prichard Committee now calls on the whole state to respond to this hard news with fresh energy and determination. As people who love Kentucky, let’s join together and get to work on building deeper insights, deeper engagement, and deeper investment, both at the state level and in each of our local communities. We invite everyone to explore the report’s evidence here, and we invite all Kentuckians to join us in renewed efforts to make education Kentucky’s pathway to a larger life and a Big Bold Future for all of us. The Prichard Committee believes in the power and promise of public education –early childhood through college– to ensure Kentuckians’ economic and social well-being. We are a citizen-led, non-partisan, solutions-focused nonprofit, established in 1983 with a singular mission of realizing a path to a larger life for Kentuckians with education at the core.

-------

The Prichard Committee believes in the power and promise of public education –early childhood through college– to ensure Kentuckians’ economic and social well-being. We are a citizen-led, non-partisan, solutions-focused nonprofit, established in 1983 with a singular mission of realizing a path to a larger life for Kentuckians with education at the core.

Kentucky Shows Promise with Post-COVID Test Scores
5 min read

Kentucky Shows Promise with Post-COVID Test Scores

The National Assessment of Educational Progress (NAEP) released their 2024 Nation’s Report Card today...

Jan. 29, 2025

Contact: Lisa McKinney, Communications Director, The Prichard Committee

(cell) 859-475-7202

lisa@prichardcommittee.org

Kentucky Shows Promise with Post-COVID Test Scores

Scores are a call to action for communities, families, educators  

LEXINGTON, Ky -- The National Assessment of Educational Progress (NAEP) released their 2024 Nation’s Report Card today, which shows Kentucky is making progress on recovering from COVID-19 learning losses. NAEP scores are drawn from a representative sample of Kentucky 4th- and 8th-graders tested every two years in reading and math.

“In today’s NAEP release, Kentucky held its ground and even posted some gains during a period when results for many states declined,” said Prichard Committee President/CEO Brigitte Blom. “While the results do not show full recovery of recent losses—both during and before the pandemic—they do show Kentucky’s strength compared to national trends, even while our students face greater challenges and our schools work with fewer resources than the nation as a whole. These gains are a testament to the commitment of Kentucky educators to use the resources at their disposal effectively and efficiently.”

For 2024 percent proficient or above, Kentucky ranks among the states:

  • 12th in grade 4 reading up from 29th in 2022  
  • 26th in grade 8 reading up from 28th in 2022  
  • 28th in grade 4 math up from 33rd in 2022
  • 32nd in grade 8 math up from 41st in 2022

In percent of students reaching NAEP proficiency or above, Kentucky’s newest results are statistically tied with the nation in grade 4 reading, grade 8 reading and grade 4 math, with results below the nation in grade 8 math. Kentucky’s 4th-grade math results showed statistically significant improvement compared to 2022.

Kentucky’s results in 4th-grade reading and 8th-grade math and reading remained steady for percent proficient or above, which makes it the first year the commonwealth has stopped the backward slide that began prior to COVID-19 and was further exacerbated by the pandemic.  

“This data demonstrates that strategic investments in schools and evidenced-backed policy actions work to move the needle on education outcomes,” said Blom. “This is the moment for families, community members, state leaders and educators to rally together to build on these gains and continue in an upward trajectory through both local action and state policy.”

The Prichard Committee will release its biennial Big Bold Future national rankings report on Feb. 6, which includes the NAEP data as well as other indicators of educational achievement and quality of life. The report contextualizes the testing scores by looking at other indicators that affect education outcomes such as poverty levels and preschool participation. The Big Bold Future report will be available on prichardcommittee.org.